Eastern Ohio has a boundary where Utica production begins to shift from a more liquid-rich west to a more gas-prone east. Which side of the line acreage occupies contributes to the value of what is produced, with oil/liquids paying a significant premium over natural gas currently.
Mahoning County has tallied 893 new oil and gas leases in 2026 through mid-October. The first new Mahoning County drilling permit issued will be the starting signal that both the industry and landowners are waiting for. Leases are acquired, units created; the drilling and completion that likely follow will enhance understanding of production potential in Mahoning County. Wells drilled in the county will de-risk adjacent acreage and provide clues for what to expect more broadly in Mahoning County and further north into Trumbull County where landowners surely await their potential lease-signing payday, along with those in Mahoning County not yet targeted.
Topic section guide for this article
- Oil vs. gas phase boundary line determines payout
- Will we see the first modern Mahoning well drilled soon?
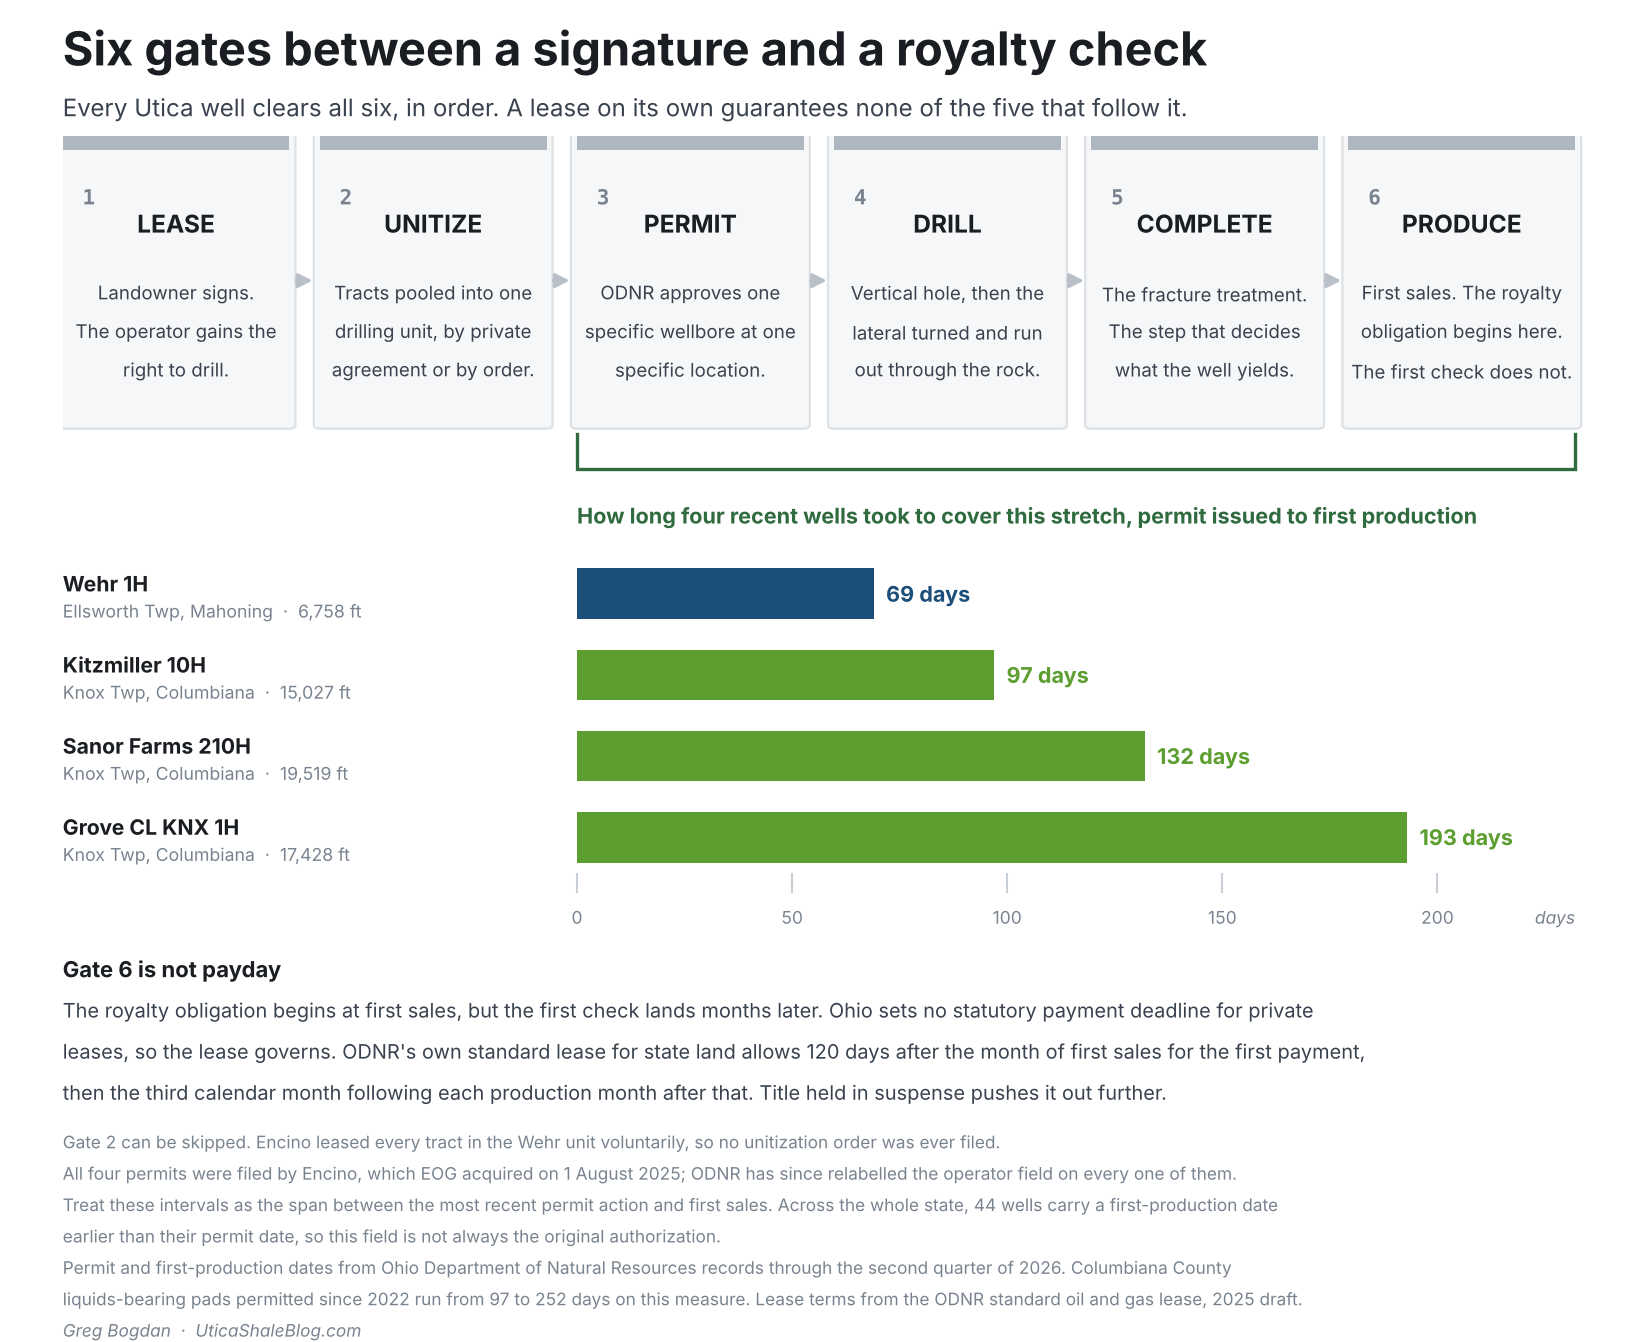
- Diagram: Six gates between a signature and a royalty check
- De-risking Mahoning County acreage will drive activity
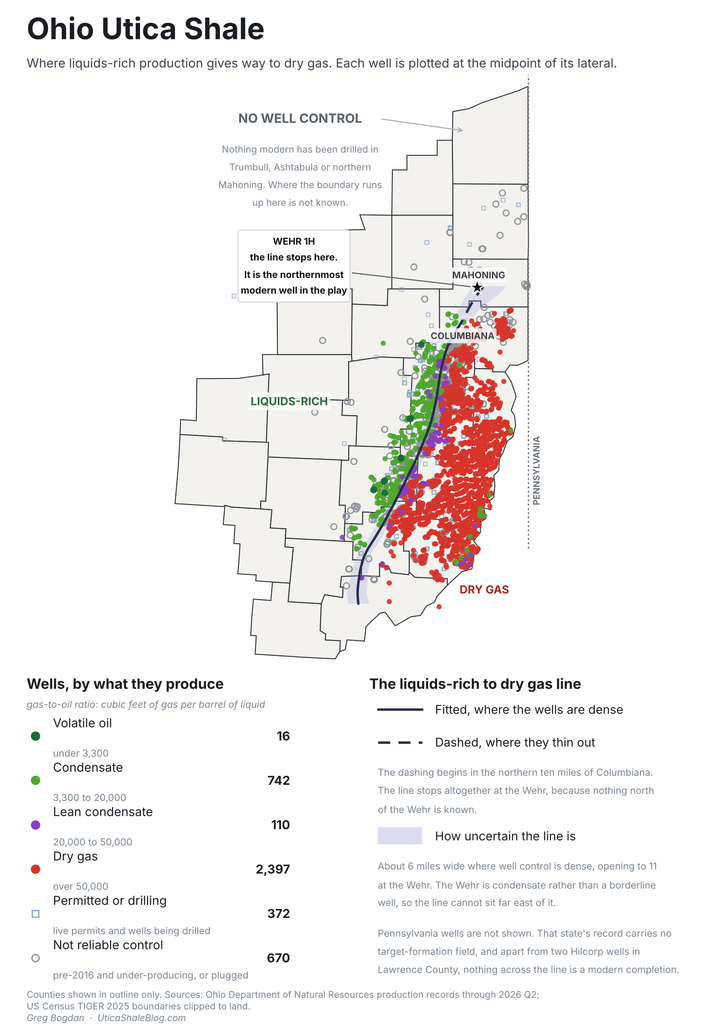
- A map of the oil/liquid-to-gas phase boundary in Eastern Ohio
- Diagram: One number defines the well, GOR (Gas to Oil Ratio)
- A single well carries everything north of Columbiana County
- The Utica/Point Pleasant Shale is not uniform, variable returns expected
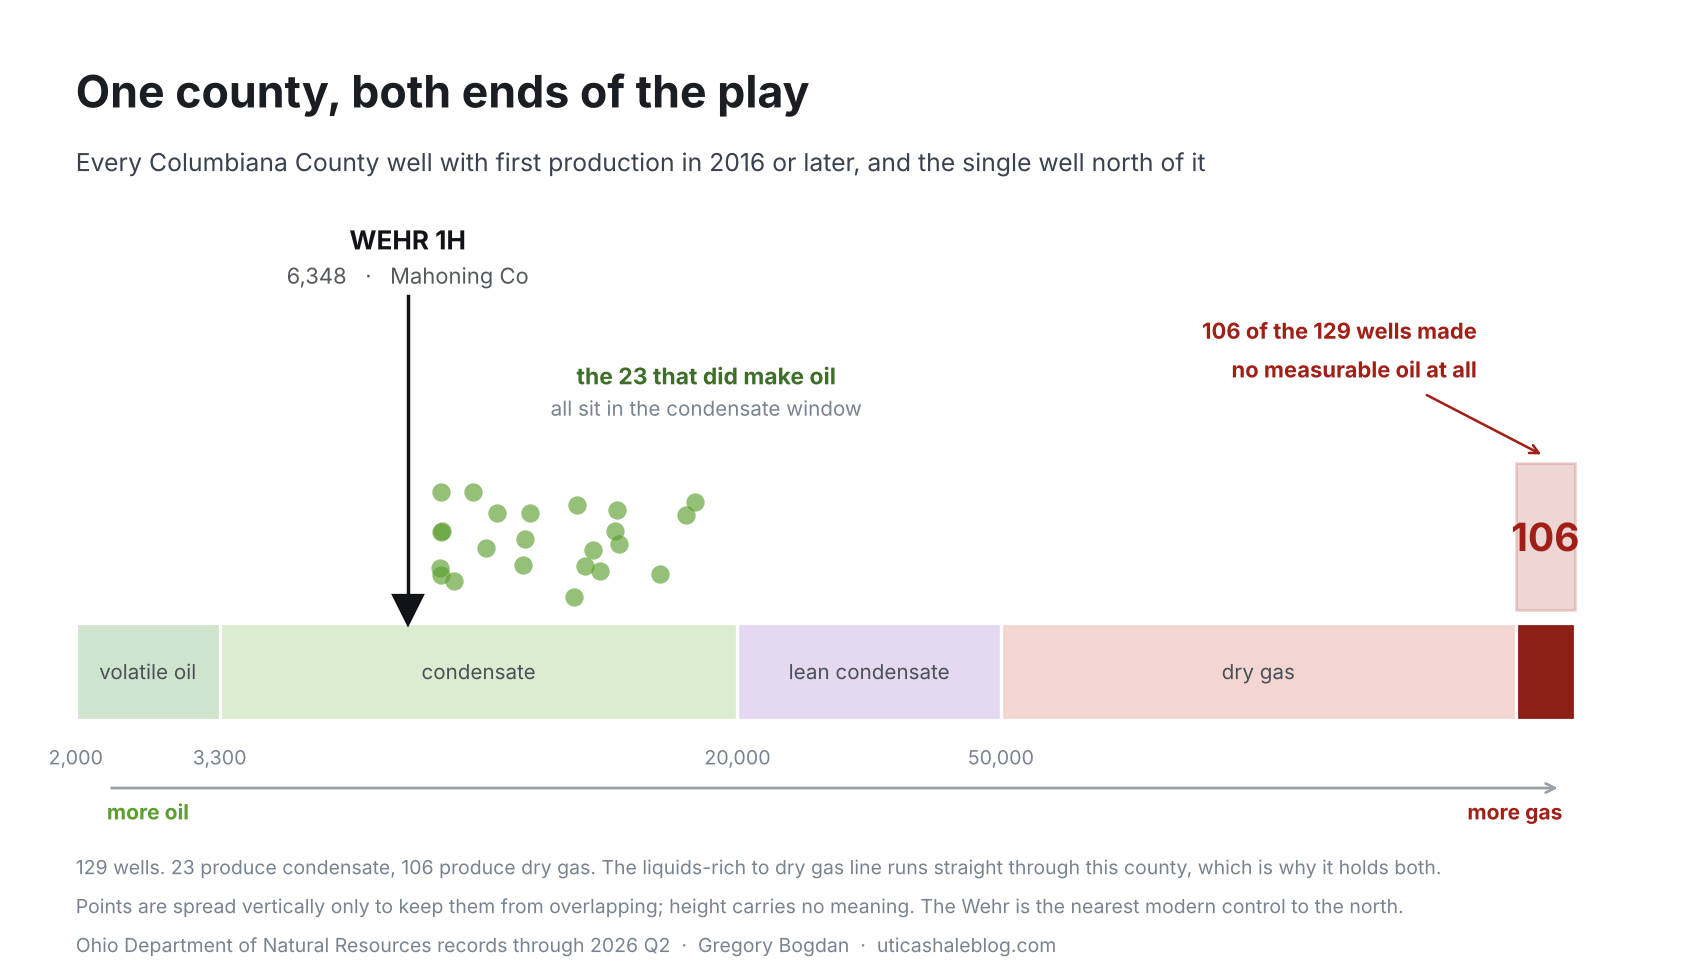
- Diagram: Modern GOR (Gas Oil Ratios) in Columbiana County
- Rock stimulation methods, economics, drive expansion north
Oil vs. gas phase boundary line determines payout
Eastern Ohio’s Utica Shale oil to gas phase boundary runs north into Mahoning County up to the Wehr 1H well where recent production numbers put the Ellsworth Township well on the liquids side of the line. North of the Wehr well, the oil/gas boundary and the Utica/Point Pleasant Shale rock have never been tested with modern completion methods. And based on the current value of oil and liquids vs. gas, leasing and drilling should favor the liquids side of that line. At current prices, oil/liquids-rich production has a roughly 3 to 5+ X advantage in many cases based on royalty/acre and typical production.
Will we see the first modern Mahoning well drilled soon?
With the Mahoning County rush to acquire subsurface rights, there is a good chance that the county will see drilling activity in 2027 or 2028, followed by the release of highly anticipated production numbers. Large investments are being made now in land acquisition alone, making a bet that drilling is coming, with 5-year leasehold agreements the standard. On the date of this writing, the oil and gas industry and the public are waiting for even the first new permit to be issued in Mahoning County.
De-risking Mahoning County acreage will drive activity
Geologists rely on data and interpretation to select drilling locations, along with economic projections for profitability, and even still there is a level of speculation. The rock north is untested past the Wehr using modern completion methods. Any modern wells drilled in some proximity to the Wehr would determine if reservoir quality (oil and gas presence) and completion quality (the ability to extract the hydrocarbon) generate the production results to justify any further development. The Wehr 1H well has de-risked, to an extent, the acreage around it. And the de-risking decreases with increasing distance from that well. More wells drilled and produced further de-risk adjacent acreage. Whether a trend line of profitable acreage connects the Columbiana cluster in Knox, Butler, West and Hanover Townships, highlighted by the Kitzmiller wells, to the Wehr, is the question the next Mahoning County wells will also begin to answer.
One number defines the well, GOR (Gas to Oil Ratio)
Two hydrocarbon streams come up from a producing well; liquid, measured in barrels, and gas, measured in cubic feet, or Mcf (thousands of cubic feet). Divide the gas by the liquid and you get the gas-to-oil ratio (GOR), the single number that defines the well as a liquid/oil producer or somewhere in between.
Extracting oil and gas production values from ODNR-reported wells shown on the map allows us to generate the oil/liquid-to-gas phase boundary. Older wells are not reliable for calculating GOR, because an under-stimulated well gives up its gas and holds back its oil. The ratio for many of the older wells, like those that resulted in dismissing the northern rock, describes the completion/stimulation method used to release hydrocarbons rather than actual hydrocarbons present in the rock.
Every producing well on the map is colored by that gas-to-oil ratio. Each dot sits at the midpoint of the well’s lateral, the horizontal section that contacts the rock. That placement matters, because a modern Utica well runs up to 3 to 4.5 miles.
A single well carries everything north of Columbiana County
The Wehr Spring Valley Farm 1H in Ellsworth Township, Mahoning County, came online in July 2025. It is the only reliable well control anywhere north of Columbiana. It produced at 6,348 cubic feet (6.35 Mcf) of gas per barrel of liquid, placing it in the condensate band but only 18 percent of the way across it, far closer to the volatile oil boundary at 3,300 than to the lean condensate boundary at 20,000. This is a rich well sitting well inside the liquids side.
The Utica/Point Pleasant Shale is not uniform, variable returns expected
Shale rock is not a uniform slab. Organic content varies. Thickness and natural fracturing vary. Thermal maturity varies. Rock ductility matters and determines if completion-induced fracs open and remain open and to what degree. Two wells a mile apart, drilled the same way in the same year, can produce noticeably different volumes of hydrocarbons.
Because the transition from liquids to gas is gradual, the line needs a qualifier. Where well control is dense the band runs about 5 miles wide. Going north it widens steadily, where the wells that would pin the line down do not exist.
Rock stimulation methods, economics, drive expansion north
Beyond geology and natural rock variability, operator-controlled variables can matter just as much. Fracking methods, from proppant type (particles injected along with frac fluid to keep induced fractures open) to the volume, pressure, and composition of injection fluid, all impact production. BP abandoned the north a little over a decade ago, most likely due to older technology that was unable to economically produce from what looked to be good rock. The next Mahoning County wells, likely to be drilled in 2027 or 2028, will determine whether the expansion marches on or ceases.
The Utica/Point Pleasant shale does not lie flat. It deepens toward the southeast, and the direction of its depth contours rotates clockwise going north. The depth to the top of the Utica/Point Pleasant Shale (EIA depth map found here) guides the oil/liquid-to-gas line, with deeper rock more gas-prone in general. Two tracts at identical depth can differ depending on how much organic material was there and how local heat flow ran. The line follows the structural depth of the Utica because that is the best indicator available north of the wells, and the band widens because the indicator is indirect.
Economics will be the ultimate governing force for investment decisions made in the Northern Tier. What lies ahead will balance a wide range of variables and data contributing to the cost of production vs. the return on production sales. Operators and land acquisition companies are currently betting on positive returns and favorable predictions—all to be tested over the coming months and years.
Production volumes, well locations, lateral lengths and completion dates come from Ohio Department of Natural Resources records through the second quarter of 2026. The gas-to-oil ratios shown are cumulative through that date and will shift as wells age.